Power BI is a collection of analytical tools and utilities enabling businesses to synthesize data and present it in structured formats. Users can create interactive dashboards and reports from localized data, up through enterprise-wide data models. The data architecture supports uniform models providing data consistency throughout the enterprise. Once dashboards and reports are created, they can easily be shared with any audience scope.
The overall Power BI technology stack includes the following components to provide an end-to-end tool set to support data harvest, formatting, staging, reporting, and sharing.
| Extraction, Transformation, Loading | Power Query |
| Data Warehouse | Power Pivot |
| Reporting | Power View, Power Map, SharePoint Online |
| Sharing | SharePoint Online, data management gateway |
| Search (new) | Power Query, Q&A |
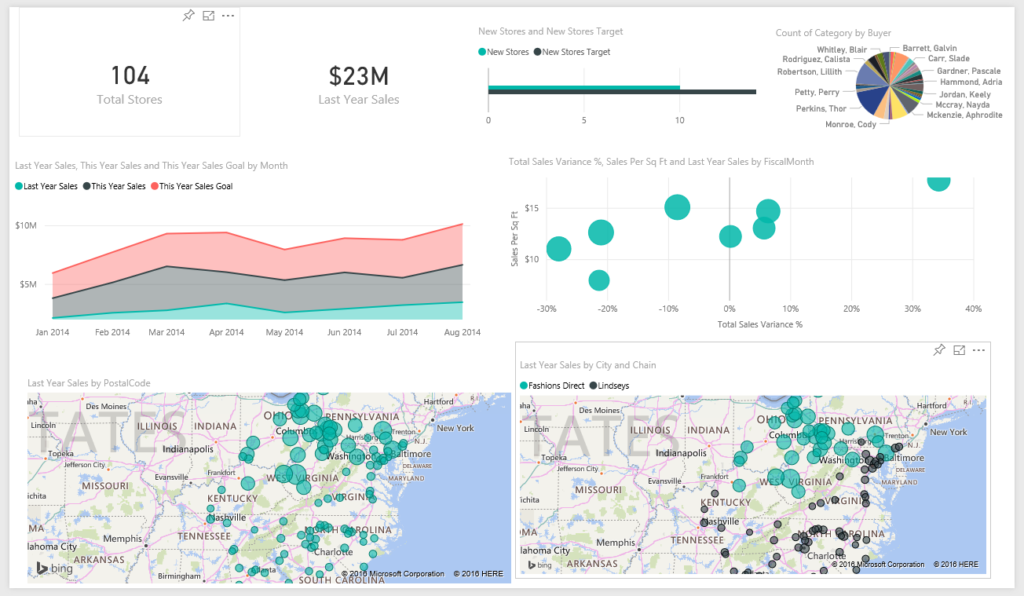
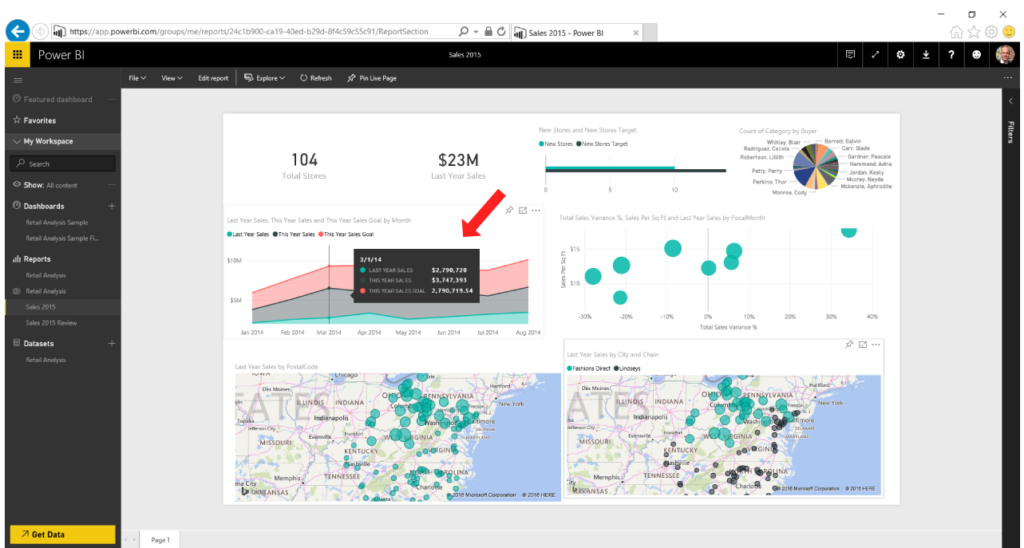
Power BI is an expansive topic and this article focuses on the creation of a Power BI Dashboards. An example is the one shown below, which shows retail sales activity for a fictional company, which had $23 million in sales last year across 104 stores. It compares this and last year’s comparative results, new store performance, sales per square foot, sales by store, and store location.
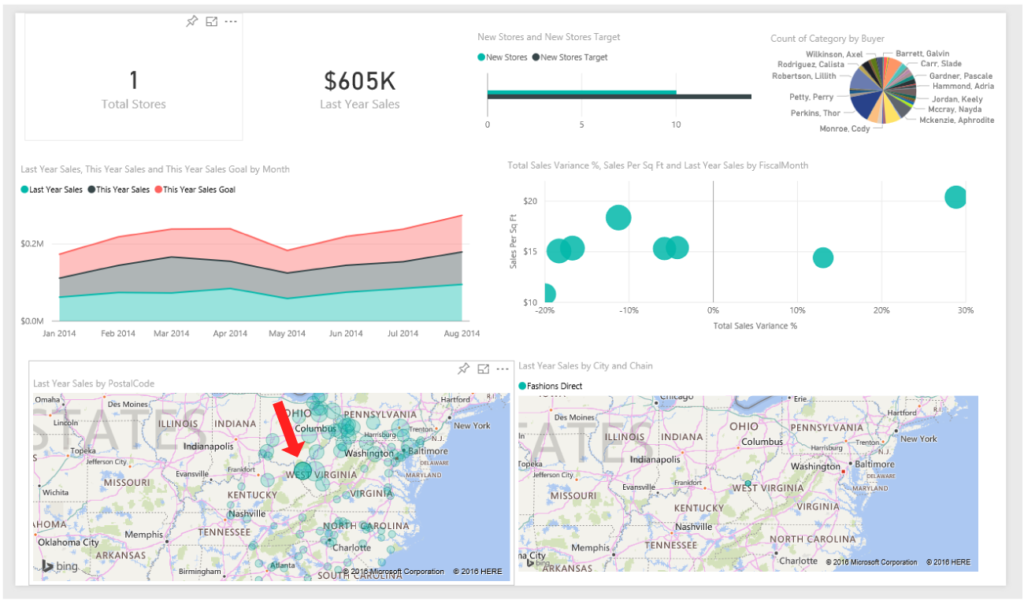
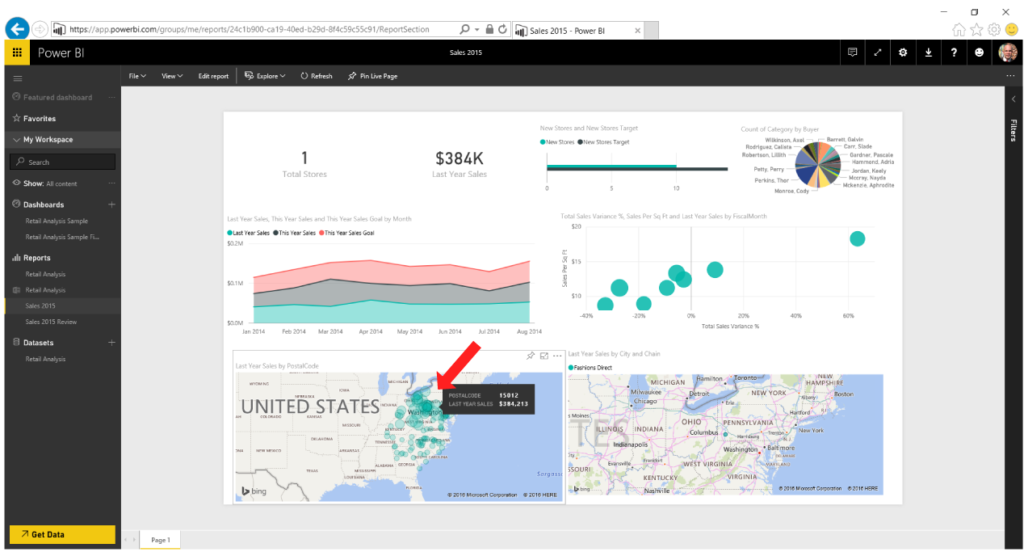
The dashboard is interactive showing filtered results as different data is selected. For example, if a single store is selected all graphs are filtered to show information for the selected store. Here, a West Virginia store is selected.
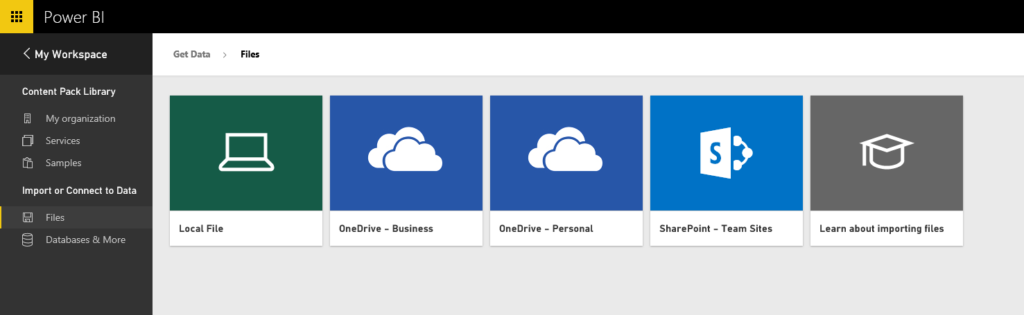
Upload data by clicking Get Data.
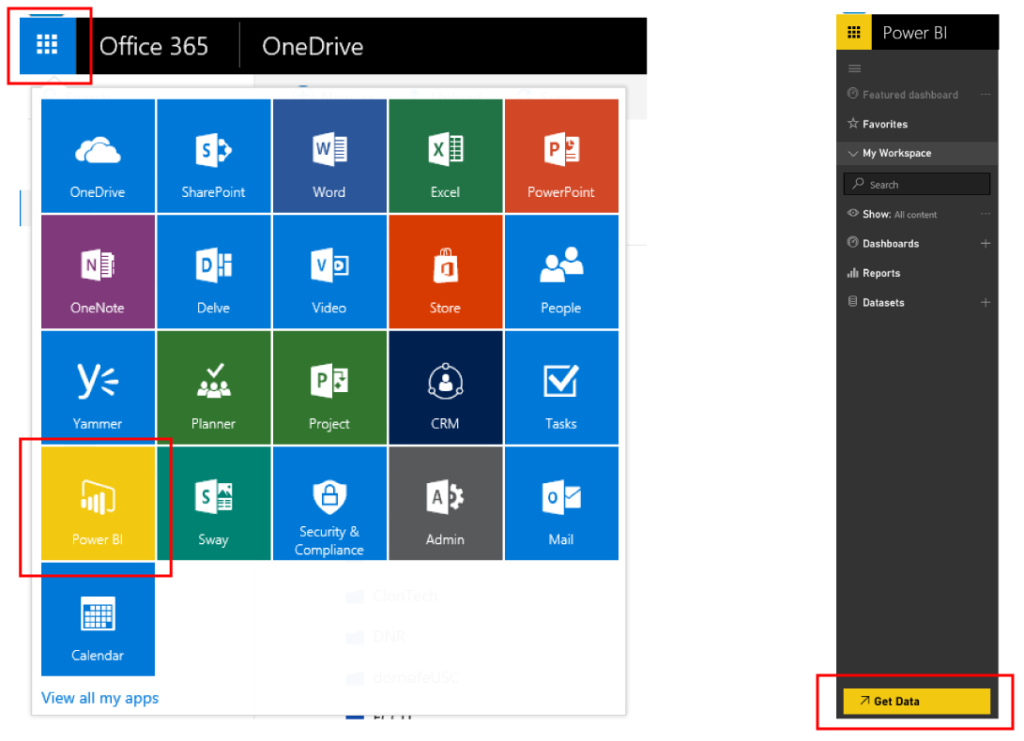
The Get Data page enables you to upload content packs, files, and databases. In this example, we are uploading an Excel file which will be the data source.
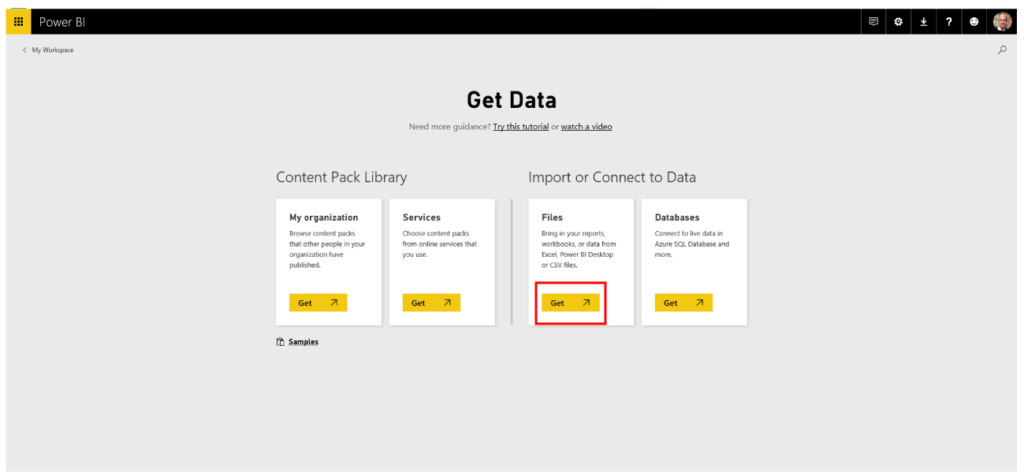
Choose the upload location of the file which can be your local machine, OneDrive for Business, Personal OneDrive, and/or SharePoint Online.
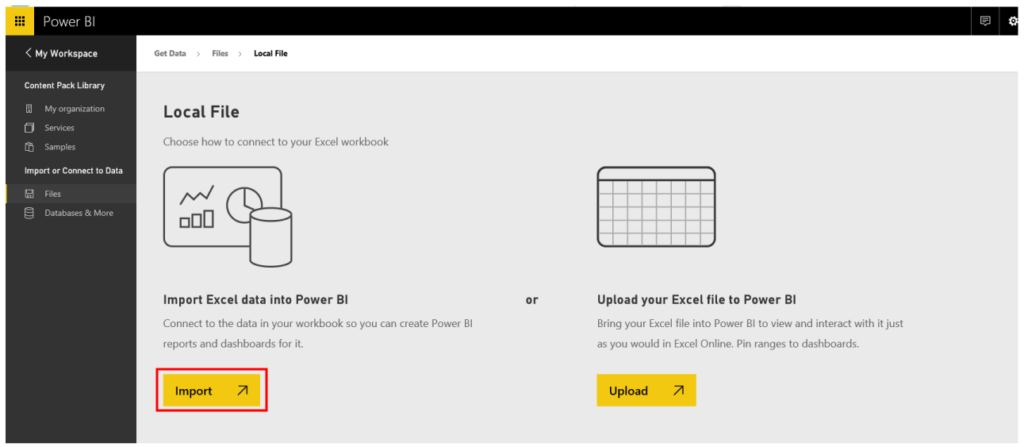
Import the Excel file.
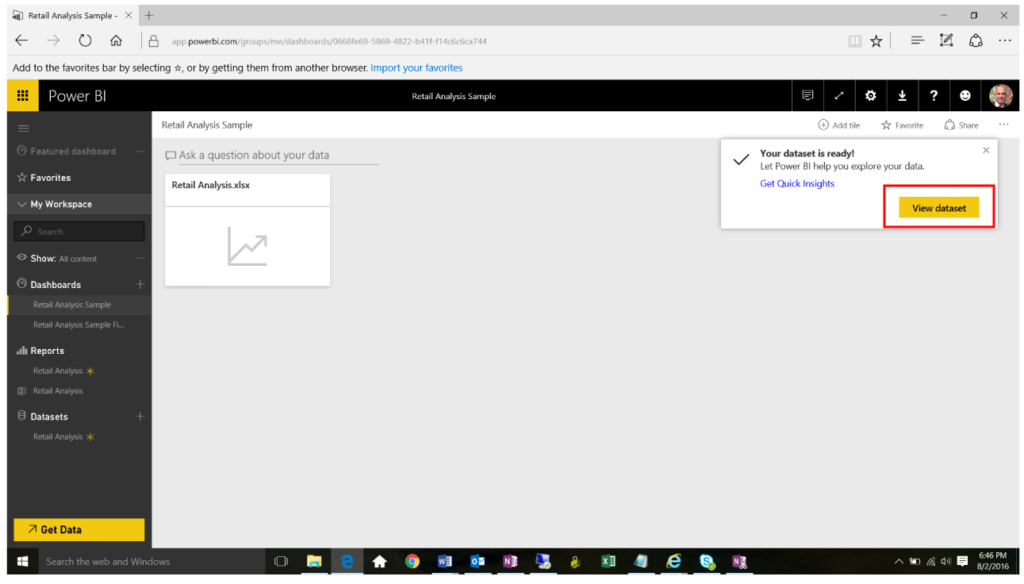
Next view the datasheet.
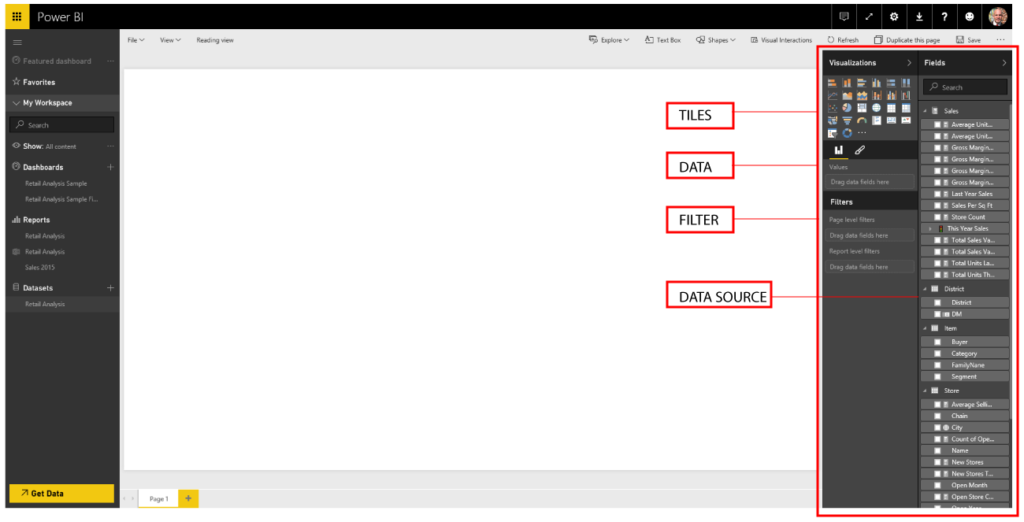
Use the Visualization and Fields panels to create and configure the dashboard tiles.
| Visualization Panel | |
| Tiles | Graph, map, text |
| Data | Tile body, axis, legend content |
| Filter | The filters used for scoping |
| Fields Panel | |
| Data Source | Data model fields |
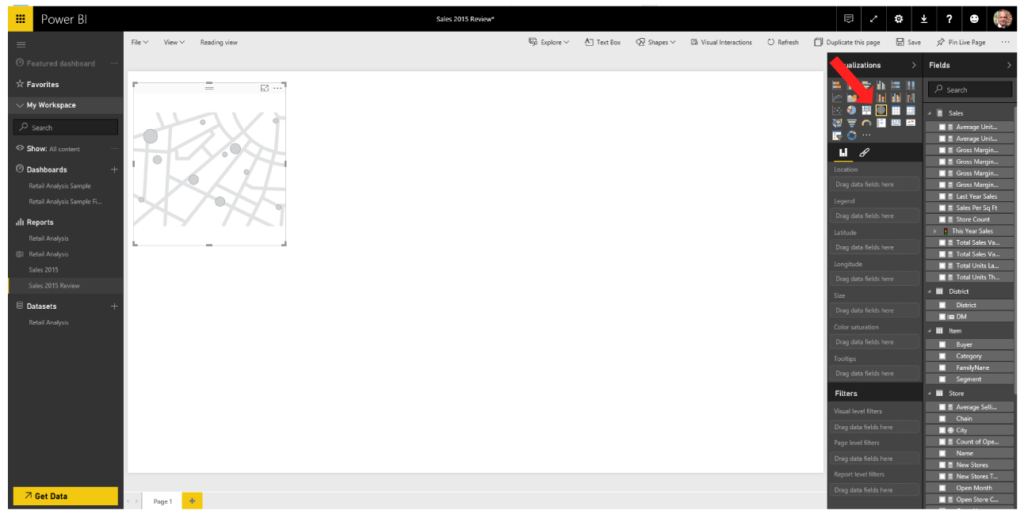
To display geographical information, create a map tile.
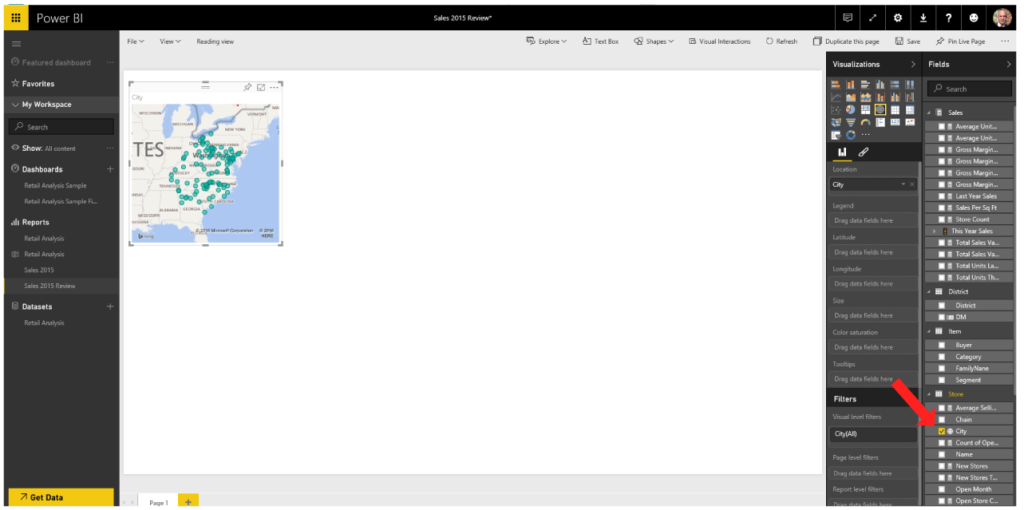
Then load store city data.
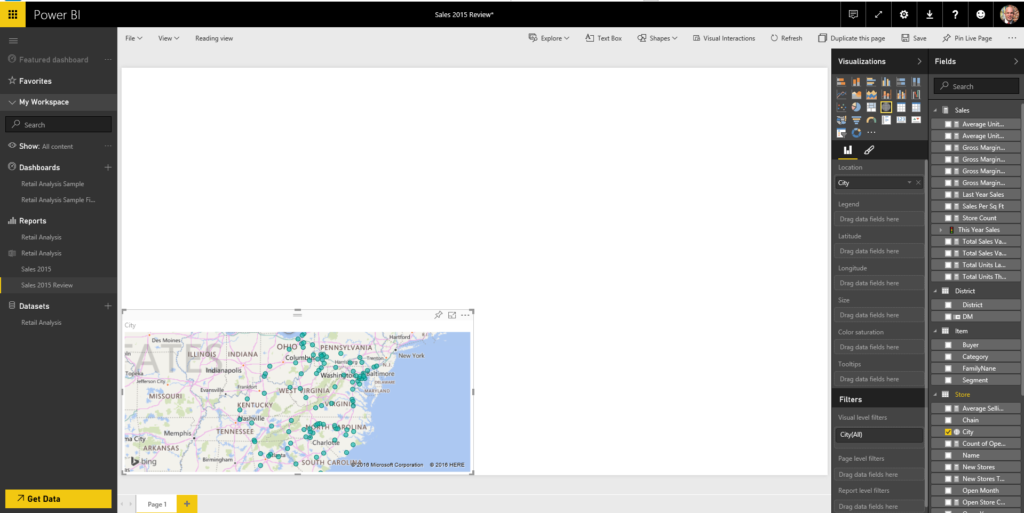
Move the tile to the desired location and size it.
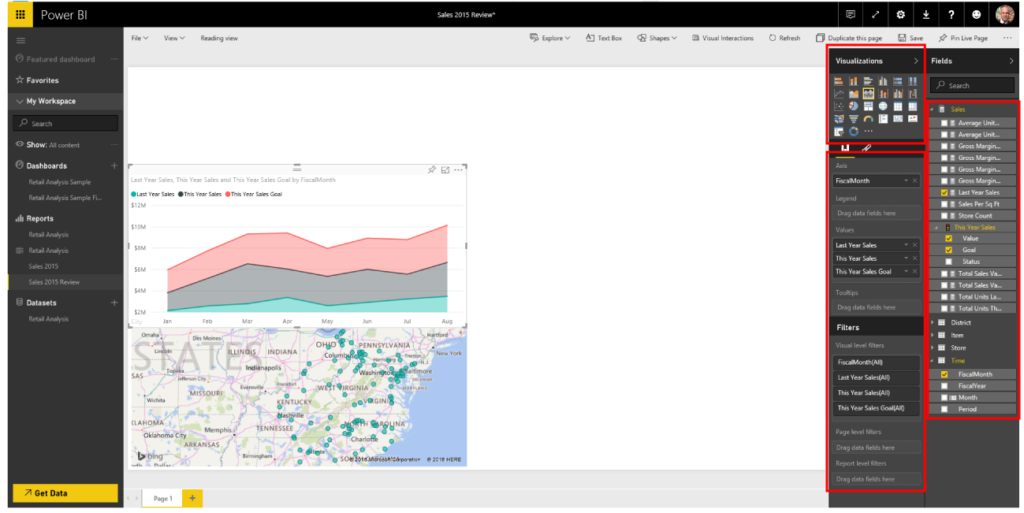
To display mountain chart line graphs, click the Stacked Area Chart icon. The sales performance data is added by selecting Last Year Sales, This Year Sales KPI Value and Goal, and FiscalMonth from the Fields pane. As each field is selected it is added to the Visualizations pane. For this graph, Axis is populated with FiscalMonth, Values is populated with Last Year Sales, This Year Sales and This Year Sales Goal. The Visualization pane is also used to configure the data filtering for the tile.
To create a text tile, click the Card icon. The text tile is used to display the total number of stores.
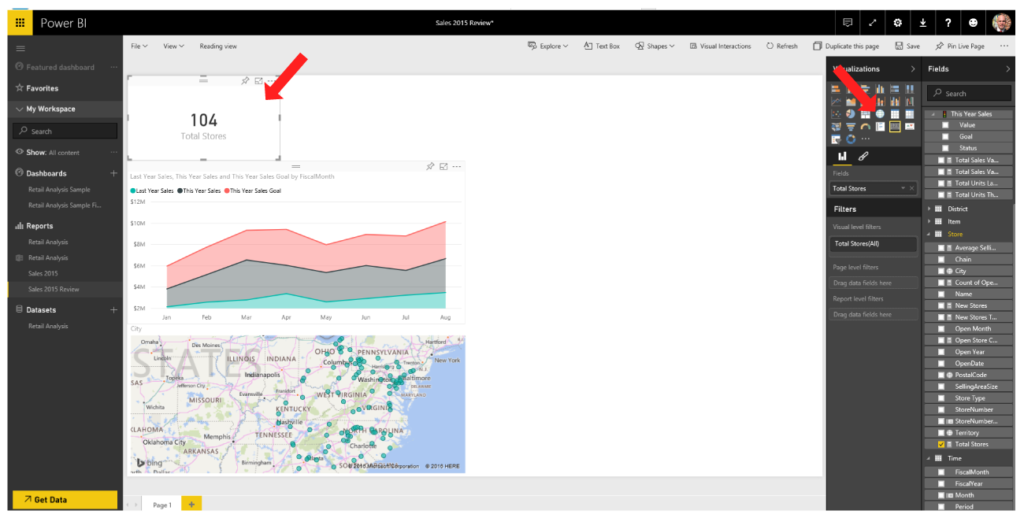
When you’ve completed your editing session, click Save.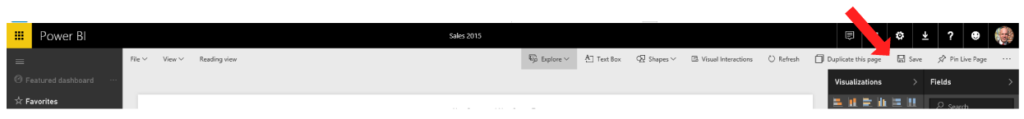
The Dashboard interactively highlights data by hovering the cursor over the tiles.
Filtering updates all tiles to show the current filtered scope. For example, clicking a single store on the Last Year Sales by PostalCode tile filters the other tiles to display data for this single store.
Conclusion
Power BI is a powerful graphical data set management, authoring and reporting suite. Its intuitive authoring environment enables users to create and manage the reports they need without needing a developer skill set or involving the IT department.
In this blog we saw how to import data into Power BI and create interactive Dashboards.
There will be future blogs covering other Power BI topics so return often to see the latest updates.
Written and composed by our Senior Microsoft SharePoint Architect, Jim Eagleton