Monitoring DMZ or isolated workgroup systems is one of the challenges we all face with System Center Operations Manager (SCOM). Until now, the only way to collect data and monitor these types of systems via SCOM was by installing a gateway to the management server. Anyone who has installed a gateway knows the pain I speak of.
Enter Operations Management Suite (OMS). OMS offers four categories of services: Insight and Analytics, Automation and Control, Protection and Recovery, and Security and Compliance. It is Microsoft's cloud-based solution for managing and protecting cloud AND on-premises infrastructure. SCOM and OMS work together to provide a full hybrid management experience, and provide a great way to introduce your company to the Microsoft Azure cloud.
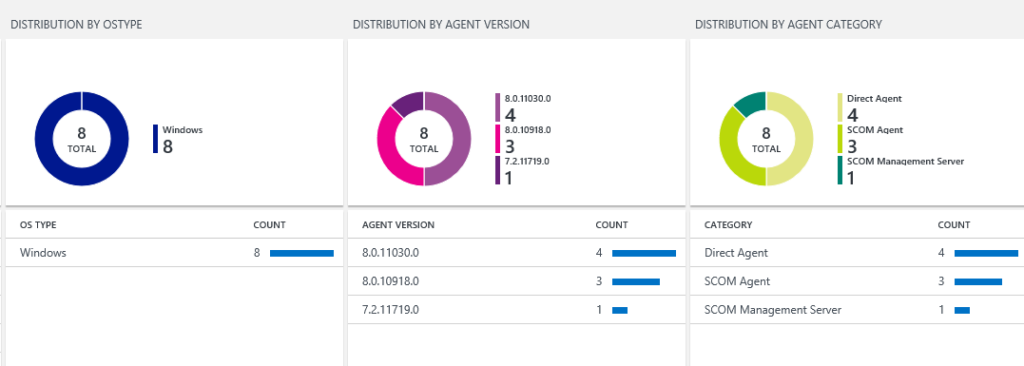
I have been using OMS to monitor my DMZ and workgroup systems either in addition to SCOM or in place of it. In this article, I will provide instructions on how to set up basic server monitoring for log analytics to get you started. This can be an existing server with the SCOM agent or a new server without the SCOM agent installed.
OMS Workspace
The first step is to create an OMS workspace, which is similar to an account. There are two options:
- Microsoft Operations Management Suite website
- Microsoft Azure subscription
You can create a free OMS workspace using the OMS website or use a Microsoft Azure subscription to create free Log Analytics workspace. Please note: Free workspaces can only send 500MB of data daily to the OMS service. All workspaces require an Azure subscription. For more information, see https://docs.microsoft.com/en-us/azure/log-analytics/log-analytics-get-started.
Configure Solutions
This example uses the Log Search solution.
- In the OMS portal, on the Overview page, choose the Settings tile. Choose Solutions -> View your installed solutions. Make sure Log Search is shown.
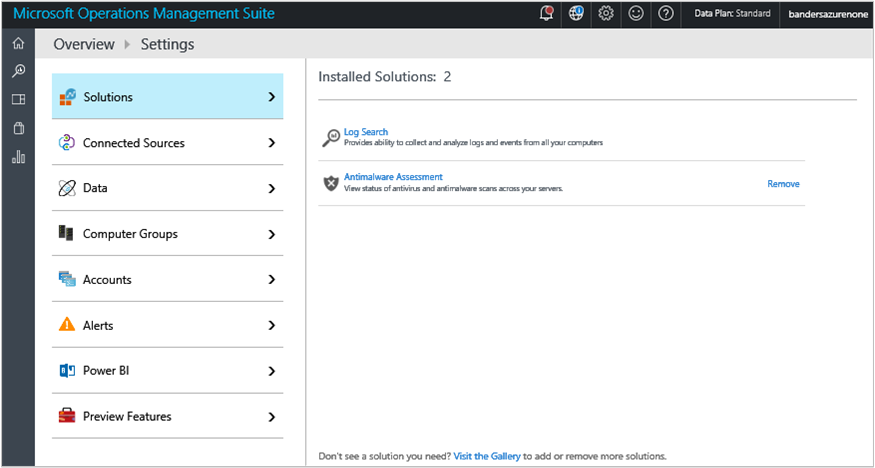
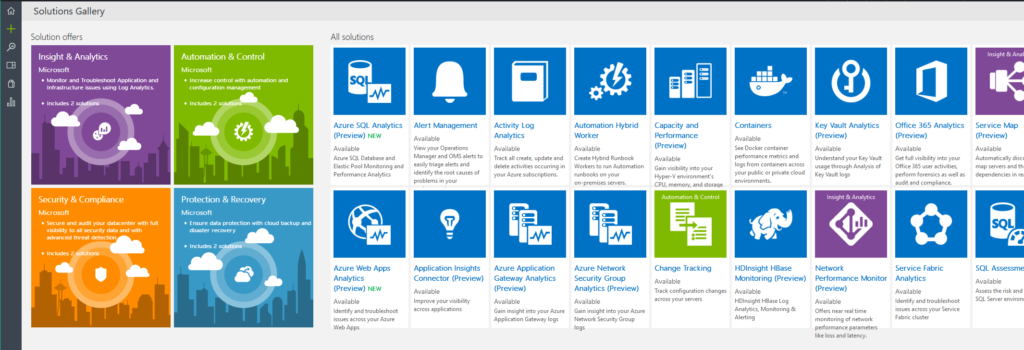
If not, choose Visit the Gallery to add it.
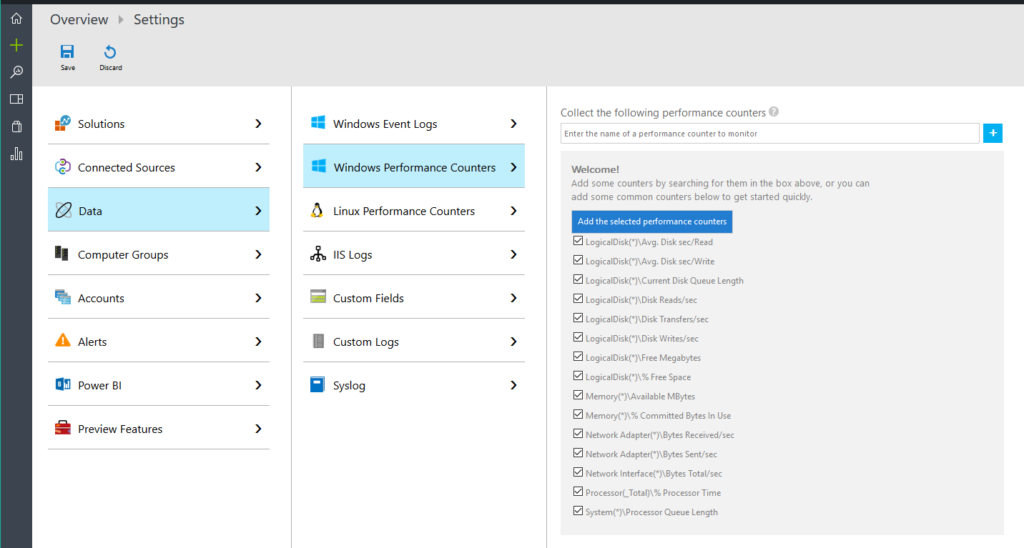
2. Choose Data to configure at least one data source to populate data to your workspace. When done, click Save.
Download the Client
After OMS has been set up, download the client. For this example, Windows Server has been chosen.
- Download the agent setup file from OMS. In the OMS portal, on the Overview page, choose the Settings tile. Select the Connected Sources tab at the top.
- Select Windows Servers and then select Download Windows Agent and select the setup file applicable to your computer processor type.
- On the right of Workspace ID, click the copy icon and paste the ID into a text editor.
- On the right of Primary Key, click the copy icon and paste the key into a text editor.

Installing the OMS Agent
*Pre-requisite - For the Microsoft Monitoring Agent to connect to and register with the OMS service, it must have access to the port number of your domains and the URLs. The following tables list the ports that OMS needs.
| Agent Resource | Ports | Bypass HTTPS inspection |
| *.ods.opinsights.azure.com | 443 | Yes |
| *.oms.opinsights.azure.com | 443 | Yes |
| *.blob.core.windows.net | 443 | Yes |
| *.azure-automation.net | 443 | Yes |
| ods.systemcenteradvisor.com | 443 |
Step 1: On the Windows server to manage, run Setup and enter the keys/ID when prompted.
Step 2: When complete, the Microsoft Monitoring Agent appears in Control Panel. When connected to OMS, the agent displays the message: The Microsoft Monitoring Agent has successfully connected to the Microsoft Operations Management Suite service.
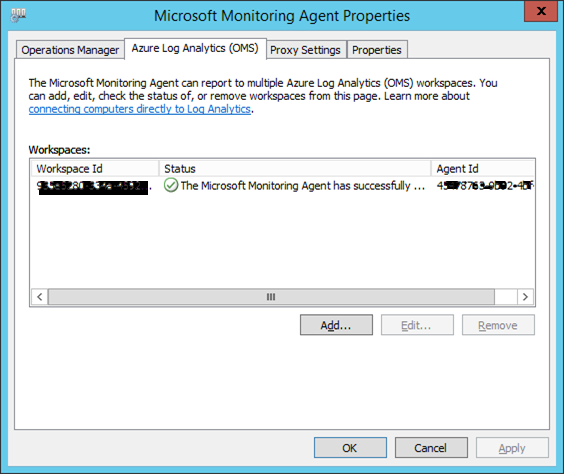
Now you are monitoring the server in OMS and can start configuring the data collection details. Below is a table for Log Analytics and a link for log searching. Part II will cover System Center integration for a true hybrid environment. Happy monitoring!
Insight & Analytics / Log Analytics
https://docs.microsoft.com/en-us/azure/log-analytics/log-analytics-log-searches
| Management solution | Platform | Microsoft monitoring agent | Operations Manager agent | Azure storage | Operations Manager required? | Operations Manager agent data sent via management group | Collection frequency |
| Activity Log Analytics | Azure | No | No | No | No | No | on notification |
| AD Assessment | Windows | Yes | Yes | No | No | Yes | 7 days |
| AD Replication Status | Windows | Yes | Yes | No | No | Yes | 5 days |
| Agent Health | Windows and Linux | Yes | Yes | No | No | Yes | 1 minute |
| Alert Management (Nagios) | Linux | Yes | Np | No | No | No | on arrival |
| Alert Management (Zabbix) | Linux | Yes | No | No | No | No | 1 minute |
| Alert Management (Operations Manager) | Windows | No | Yes | No | Yes | Yes | 3 minutes |
| Application Insights Connector (Preview) | Azure | No | No | No | No | No | on notification |
| Azure Networking Analytics (Preview) | Azure | No | No | Yes | No | No | 10 minutes |
| Capacity Management | Windows | No | Yes | No | Yes | Yes | hourly |
| Containers | Linux | Yes | No | No | No | No | 3 minutes |
| Key Vault Analytics (Preview) | Windows | No | No | Yes | No | No | 10 minutes |
| Network Performance Monitor | Windows | Yes | Yes | No | No | No | TCP handshakes every 5 seconds, data sent every 3 minutes |
| Office 365 Analytics (Preview) | Windows | No | No | No | No | No | on notification |
| Service Fabric Analytics | Windows | No | No | Yes | No | No | 5 minutes |
| Service Map | Windows and Linux | Yes | Yes | No | No | Yes | 15 seconds |
| SQL Assessment | Windows | Yes | Yes | No | No | Yes | 7 days |
| SurfaceHub | Windows | Yes | No | No | No | No | on arrival |
| System Center Operations Manager Assessment (Preview) | Windows | Yes | Yes | No | No | Yes | seven days |
| Upgrade Analytics (Preview) | Windows | Yes | No | No | No | No | 2 days |
| VMware Monitoring (Preview) | Linux | Yes | No | No | No | No | 3 minutes |
| Wire Data | Windows (2012 R2 / 8.1 or later) | Yes | Yes | No | No | No | 1 minute |
Written and composed by our Senior Microsoft System Center Architect, Jessica Ervin-Hang

